
Visual Intelligent RHMS: Bridging the Gap Between Remote Sensors and Clinical Decisions
Visual intelligent remote healthcare monitoring system using multi-agent technology
This paper introduces a Visual Intelligent Remote Healthcare Monitoring System (RHMS) utilizing Multi-Agent Systems (MAS). The framework integrates data mining, dynamic Bayesian networks, and interactive visualization to process real-time biometric and environmental sensor data for elderly care.
TL;DR
Current healthcare infrastructures are overwhelmed by the data stream from wearable sensors. This paper presents a Visual Intelligent Remote Healthcare Monitoring System (RHMS) that leverages Multi-Agent Technology to automate data processing while keeping clinicians in the loop through advanced visualization. By utilizing Dynamic Bayesian Networks, the system achieves a 75% accuracy rate in detecting health deterioration, significantly reducing the cognitive burden on medical staff.
The Motivation: Moving Beyond "Data Collection"
Remote monitoring is no longer just a hardware problem—it is an information processing crisis. While sensors can easily capture heart rate and blood pressure, the sheer volume of this data makes it nearly impossible for clinicians to identify subtle, long-term trends in real-time.
Existing systems often suffer from:
- High False Alarm Rates: Simple threshold triggers don't account for the temporal context.
- Cognitive Overload: Raw data streams are difficult for humans to interpret under pressure.
- Lack of Scalability: Centralized processing fails as the number of monitored patients grows.
The authors propose that the solution lies in Multi-Agent Systems (MAS), where autonomous software entities handle specific tasks—from signal processing to decision-making—in a coordinated, decentralized fashion.
Methodology: A Three-Layered Intelligence
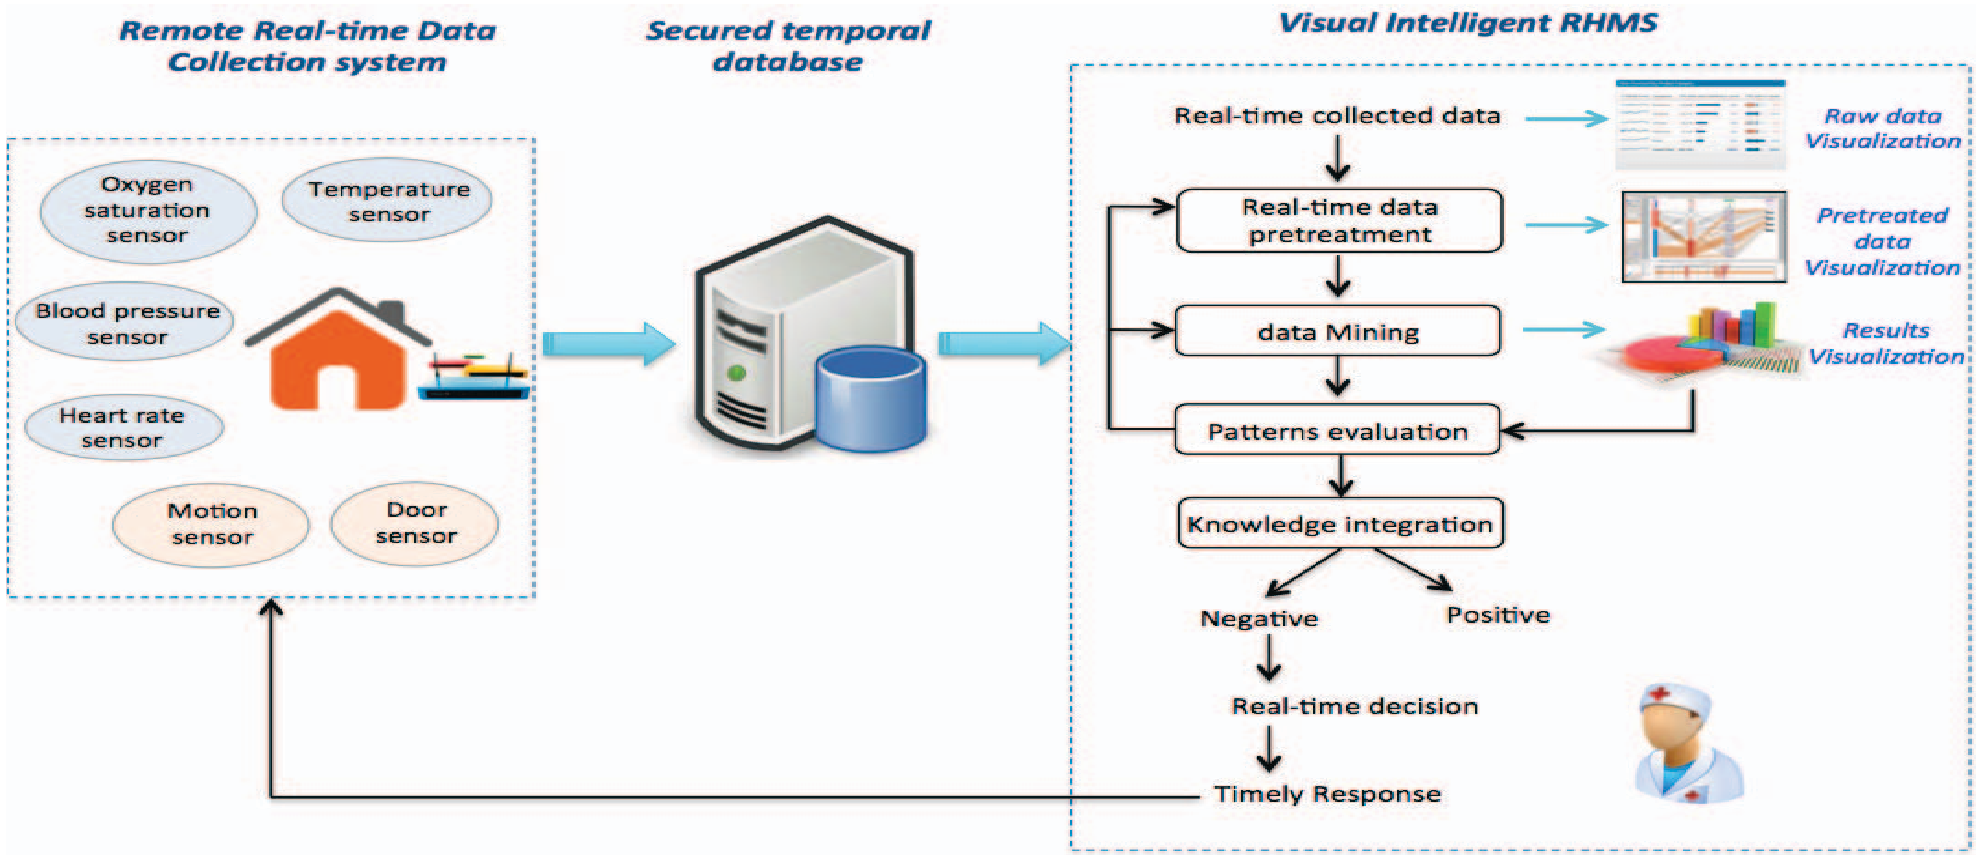
The architecture is divided into three distinct functional layers, each governed by specialized agents:
1. The Sensing Data Monitoring Layer
This layer handles the "physical" interface. Remote Sensing Agents collect data from environmental (motion) and vital (biometric) sensors. A Signal Processing Agent then extracts relevant features using time-domain operations.
2. The Data Analysis Layer (The Engine)
This is where the transformation from data to knowledge occurs.
- Data Fusion Agent: Combines disparate sensor streams.
- Data Mining Agent: Utilizes Dynamic Bayesian Networks (DBN). Unlike static models, DBNs are chosen for their intrinsic ability to model temporal sequences, making them perfect for tracking disease progression.
3. The Decision Making Layer
Instead of replacing the doctor, this layer supports them. The Knowledge Integration Agent generates alerts based on DBN probabilities, while the Visualization Agent renders this data using interactive techniques like "Life Lines."
Why It Works: The Power of Visual Data Mining
The cornerstone of this research is the Visual Data Mining paradigm. The authors argue that visualization shouldn't just be an "output" at the end of the process. Instead, they implement the second paradigm of visual mining: visualizing input data and extracted patterns simultaneously to allow for human-driven pattern recognition.
Two specific techniques are highlighted:
- Concentric Circles: Ideal for periodic biometric data, allowing clinicians to see daily or hourly cycles at a glance.
- Life Lines: A proven environment for navigating complex patient records.
Experimental Results & Performance
The system was evaluated through two lenses: Utility and Usability.
1. Predictive Accuracy
Using a test base of 40 patients, the DBN-driven agents achieved:
- Overall Classification Rate: 75%
- Negative Prediction Capacity: 82% (Excellent for ruling out "false alarms")
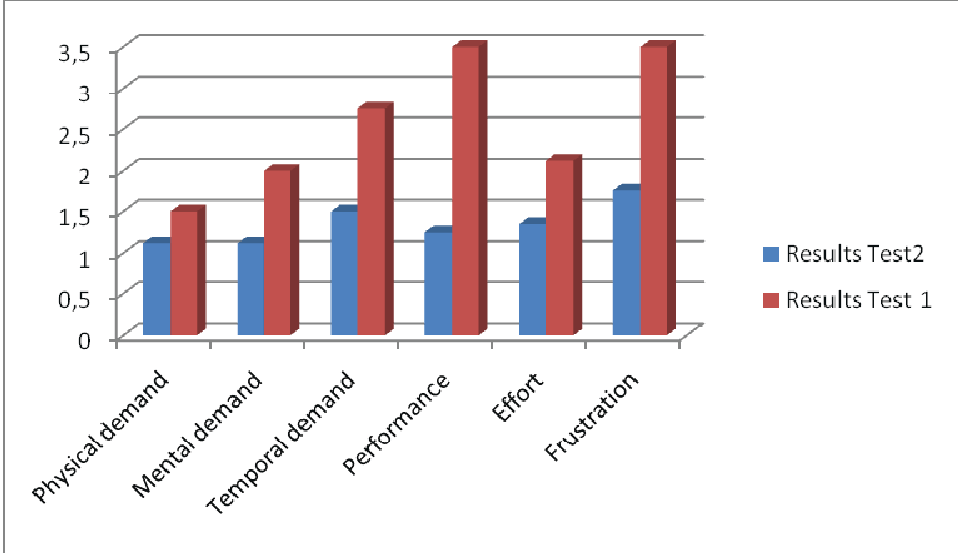
2. NASA-TLX Cognitive Load Analysis
The researchers compared raw data visualization against "Pattern Visualization." The results, seen in the histogram below, indicate that while physical demand remains low, the performance of users increases significantly when using the agent-enhanced visual tools.
Critical Insights & Future Outlook
This work positions MAS as a robust backbone for RHMS. By delegating data cleaning, fusion, and mining to independent agents, the system achieves a level of "active" monitoring that classical centralized systems cannot match.
Limitations:
- The Data Preparation Agent remains theoretical in this prototype.
- The 54% positive prediction capacity suggests that while the system is good at identifying healthy states, it still needs refinement in pinpointing specific "positive" alarm events.
The Road Ahead: The future of this technology lies in Mobile Visual Intelligent RHMS and the integration of richer sensor types, such as vision-based fall detection, to provide a truly holistic view of patient health within the "Smart Home" ecosystem.
Summary Takeaway: This MAS-based approach successfully shifts RHMS from a passive alarm system to a proactive clinical decision support tool, proving that the synergy between AI modeling and human-centric visualization is the key to scalable remote care.