
Mapping the Invisible: Investigating Terrorist Patterns through Synthetic Social Networks
Visual investigation of similarities in Global Terrorism Database by means of synthetic social networks
The paper introduces a framework for constructing "Synthetic Social Networks" from the Global Terrorism Database (GTD) to visualize similarities between terrorist organizations. By combining association rule mining (via the GUHA method) and cosine similarity clustering, the authors map latent behavioral patterns into a graph-based representation to track the evolution of terrorist communities over time.
TL;DR
Analyzing global terrorism is often a struggle against data fragmentation. This paper proposes a novel methodology to move beyond simple maps and charts by building Synthetic Social Networks. By applying association rule mining and similarity measures to the Global Terrorism Database (GTD), the authors create a "behavioral graph" that reveals how different terrorist groups share tactics and how these alliances or similarities evolve over time.
Problem & Motivation: The High-Dimensionality Trap
Standard exploratory tools for the GTD, such as "Data Rivers," are excellent for viewing trends but fail when we ask: "Which groups behave similarly to Al-Qaeda, even if they operate in different regions?"
The primary challenge is the explosion of categories. With thousands of groups and hundreds of countries, traditional categorical correlation plots become unreadable. The authors identify a need for a "filter" that ignores noise and focuses only on Typical Behavior—the core tactics that define a group’s operational identity.
Methodology: From Incidents to Graph Nodes
The core of this research is the transition from a flat database to a weighted graph. This is achieved in three distinct phases:
1. Defining "Typical Behavior"
Instead of manually selecting features, the authors use Association Rule Mining (specifically the GUHA method). They look for rules like: A behavior is considered "Typical" only if it meets a threshold of support () and confidence (). These "founded implications" act as a statistical filter to extract the essence of a group's strategy.
2. The Synthetic Transition
Each group is represented as a high-dimensional vector based on these rules. The authors then apply the Cosine Measure to calculate the distance between any two groups.
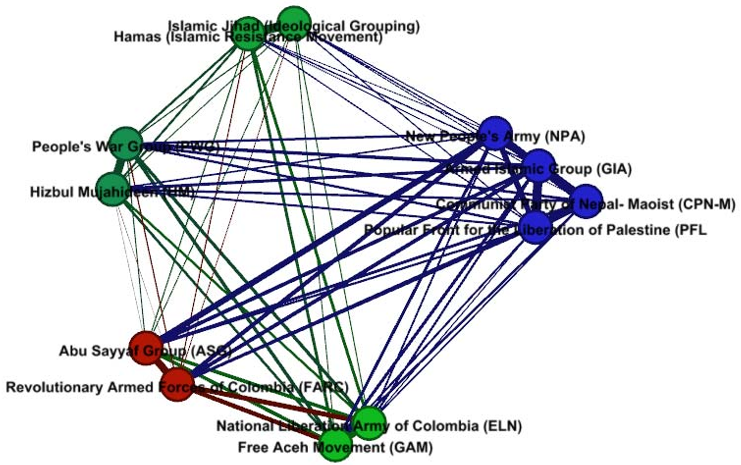 Figure 1: The resulting graph where nodes are groups and edges represent the strength of behavioral similarity.
3. Visualizing Evolution
By applying the Force Atlas 2 layout, groups with similar behaviors naturally "clump" together into communities. By generating these graphs for successive years (e.g., 2000 vs. 2001), researchers can literally see the network "grow" and "split."
Experiments & Results: A Growing Threat
The authors tested their model using two different configurations: one with 8 attributes and one with 12.
| Metric | 2000 (12 attrs) | 2001 (12 attrs) |
|---|---|---|
| Nodes | 30 | 34 |
| Edges | 156 | 209 |
| Number of Communities | 3 | 4 |
The results (detailed in Table III of the paper) show an increasing complexity in the global landscape. Between 2000 and 2001, the Average Degree increased significantly, suggesting that terrorist groups were increasingly adopting a shared "standard" of tactics, leading to a denser network of similarities.
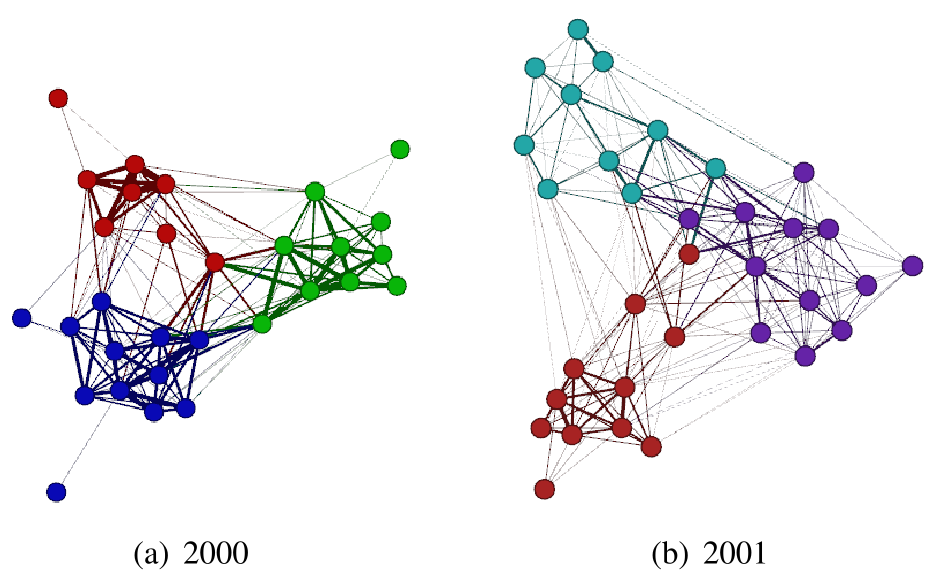 Figure 2: Evolution of the network from 2000 to 2001. Notice the emergence of new clusters and the thickening of edges, signifying stronger behavioral alignment.
Critical Analysis & Conclusion
Takeaway
The paper effectively demonstrates that graphs are a superior abstraction for behavioral analysis in terrorism. By quantifying "similarity" as a distance in a tactical vector space, the authors provide a tool that can help intelligence analysts identify the "likely suspect" for an unattributed attack based on its behavioral signature.
Limitations
- Temporal Lag: The data used (2000-2002) is historical; modern terrorism involves decentralized "lone wolf" actors who may not form the distinct "groups" required for this specific node-based analysis.
- Attribute Sensitivity: As shown in the comparison between 8 and 12 attributes, the choice of what constitutes "behavior" drastically changes the community structure.
Future Outlook
The next step for this research should be the integration of Temporal Knowledge Graphs. Instead of discrete "snapshots" of 2000 and 2001, a continuous-time model could predict which group is most likely to adopt a new tactic (e.g., drone usage) based on its current position in the synthetic network.