
Navigating the Human Continent: Visualizing Info-Flows in Million-Node Social Networks
Visualization of information flows in a very large social network
The paper presents a visualization system for very large social networks (e.g., 1M+ nodes) focusing on information flow monitoring. It introduces a "virtual continent" layout strategy mapping clusters to radial sectors and node importance to central proximity, enabling real-time navigation and zooming.
TL;DR
Visualizing a social network with over a million nodes is a recipe for a "hairball" disaster. This paper introduces an architecture that maps massive social graphs into a structured "virtual continent," using PageRank to highlight influential hubs and Metis clustering to organize communities into navigable pie-shaped sectors. The result is a system that doesn't just show who is connected to whom, but specifically tracks how information—like advertisements—ripples through the social fabric.
Problem: The Scalability Wall
When dealing with online social networks like Facebook or Orkut, the sheer density of data makes traditional force-directed layouts fail.
- Visual Overload: Even if you represent one node as a single pixel, a million-node network exceeds standard screen resolutions.
- Link Noise: Dense connections obscure the underlying structure, making it impossible to see propagation paths.
- Latency: Users expect smooth zooming and panning, which is computationally expensive for large subgraphs.
The authors argue that visualization should prioritize Information Flow over simple Pattern Discovery. It’s not just about the "shape" of the network; it's about the "journey" of data through it.
Methodology: The Virtual Continent
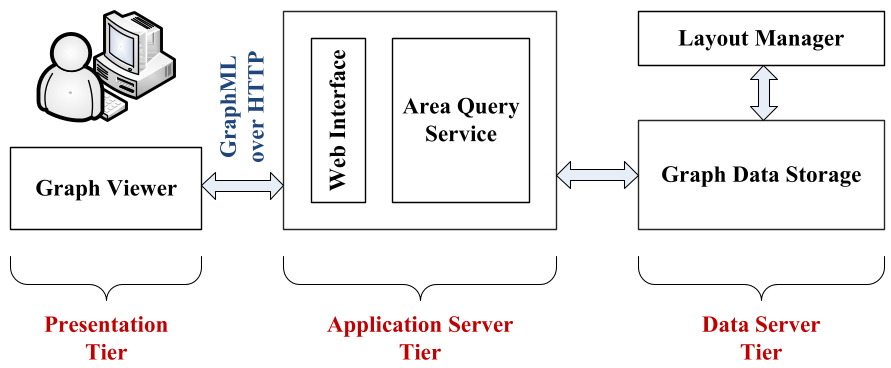
To solve the scalability issue, the researchers proposed a three-tier architecture (Data, Application, and Presentation) driven by a unique "Pie Layout" logic.
1. The Ranking & Clustering Engine
The layout manager processes the graph in three phases:
- Clustering (via Metis): Nodes are grouped into disjoint sets. Information tends to circulate heavily within these clusters before jumping to others.
- Ranking (via PageRank): Every node is assigned an importance score. This allows the system to perform "top-k" filtering—rendering only the most important nodes when the user is zoomed out.
2. The Pie-Sector Layout
Instead of a chaotic cloud, the network is organized into a circle:
- Sectors: Each cluster is assigned a sector of the "pie" proportional to its size.
- Centrality: High-PageRank nodes (Hubs) are placed at the center, while "loner" nodes sit on the outskirts. This creates a "Rendezvous Point" at the center where inter-cluster interaction is most visible.
Visualizing Information Propagation
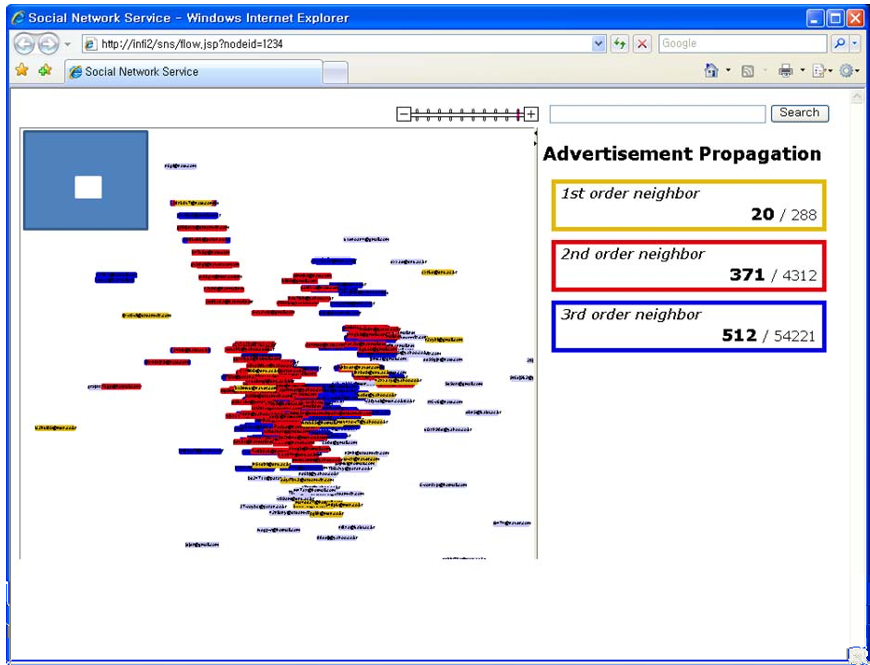
The true value of this layout is seen in the "Information Flow" mode. To maintain readability, the authors made a strategic choice: Omit most links.
Instead of drawing millions of lines, they use a Heatmap/Color-distance approach to show propagation from a source node:
- Yellow: 1st-order neighbors (Direct reach).
- Red: 2nd-order neighbors.
- Blue: 3rd-order neighbors.
This reveals how an advertisement spreads within its own cluster versus how it leaks into the broader network continent. Unreached nodes remain in a "stale" color, providing immediate visual contrast of the campaign's penetration.
Critical Analysis & Conclusion
The "Virtual Continent" approach is a masterful exercise in Inductive Bias. By assuming that hub nodes are the most important and that clusters should be visually separated, the authors provide a mental model that humans can actually navigate.
Key Takeaways:
- Selective Interest: By omitting imagery and links for non-essential nodes, readability is preserved even at massive scales.
- Efficient Queries: The top-k node selection based on PageRank ensures that the application server only sends what the screen can actually display.
Limitations: While the pie-layout is excellent for cluster-based navigation, it may distort the actual "spatial" distance between nodes that belong to different clusters but share many mutual friends. Modern approaches might use Latent Space embeddings to address this, but the computational cost would be significantly higher than the PageRank/Metis combo proposed here.
In summary, this work remains a foundational reference for how to balance computational efficiency with human-centric interaction in the era of Big Data.