
Decoding the Aging Brain: An Explainable AI Approach to Functional Connectivity
Visualizing functional network connectivity difference between middle adult and older subjects using an explainable machine-learning method
This study presents an explainable machine learning framework to classify middle adult (MA) and older adult (OA) subjects using whole-brain Functional Network Connectivity (FNC) from the UK Biobank (n=9394). Utilizing RF, XGBoost, and CATBoost combined with SHAP (SHapley Additive exPlanations), the researchers achieved classification AUCs up to 0.75 while identifying the Cognitive Control Network (CCN) and Subcortical Network (SCN) as primary biomarkers of aging.
TL;DR
Researchers have successfully leveraged ensemble machine learning (XGBoost, CATBoost) and SHAP interpretability to distinguish middle-aged adults from older adults using fMRI data. By analyzing the "chatter" between 53 brain sub-nodes, the study identifies that the Cognitive Control and Subcortical Networks undergo the most significant functional reorganization as we age, characterized by a complex pattern of both connectivity loss and gain.
Problem & Motivation: Beyond Simple Correlation
Cognitive aging isn't just about localized "brain shrinkage"; it's about how the network-wide communication shifts. While prior work has focused on the Default Mode Network (DMN) in extreme age gaps (young vs. old), few have studied the transition from middle adulthood (45-63) to older adulthood (64+).
More importantly, traditional statistics often look at one connection at a time. This "univariate" view misses the big picture. The authors argue that machine learning can capture the high-dimensional interactions between networks, while Explainable AI (XAI) can translate these complex models back into neurological insights.
Methodology: The Neuromark & SHAP Framework
The study utilizes a massive dataset of 9,394 subjects from the UK Biobank. The workflow follows three critical stages:
- Network Extraction: Using the Neuromark pipeline, they identified 53 data-driven independent components (ICNs) across seven domains: Subcortical (SCN), Auditory (ADN), Sensorimotor (SMN), Visual (VSN), Cognitive Control (CCN), Default Mode (DMN), and Cerebellar (CBN).
- Connectivity Mapping: They computed the Functional Network Connectivity (FNC) using Pearson correlation, resulting in 1,378 unique connectivity features per person.
- Explainable Classification: Three tree-based models (RF, XGBoost, CATBoost) were trained to classify MA vs. OA. Finally, the SHAP (SHapley Additive exPlanations) method was applied to rank which of these 1,378 connections actually mattered for the decision.
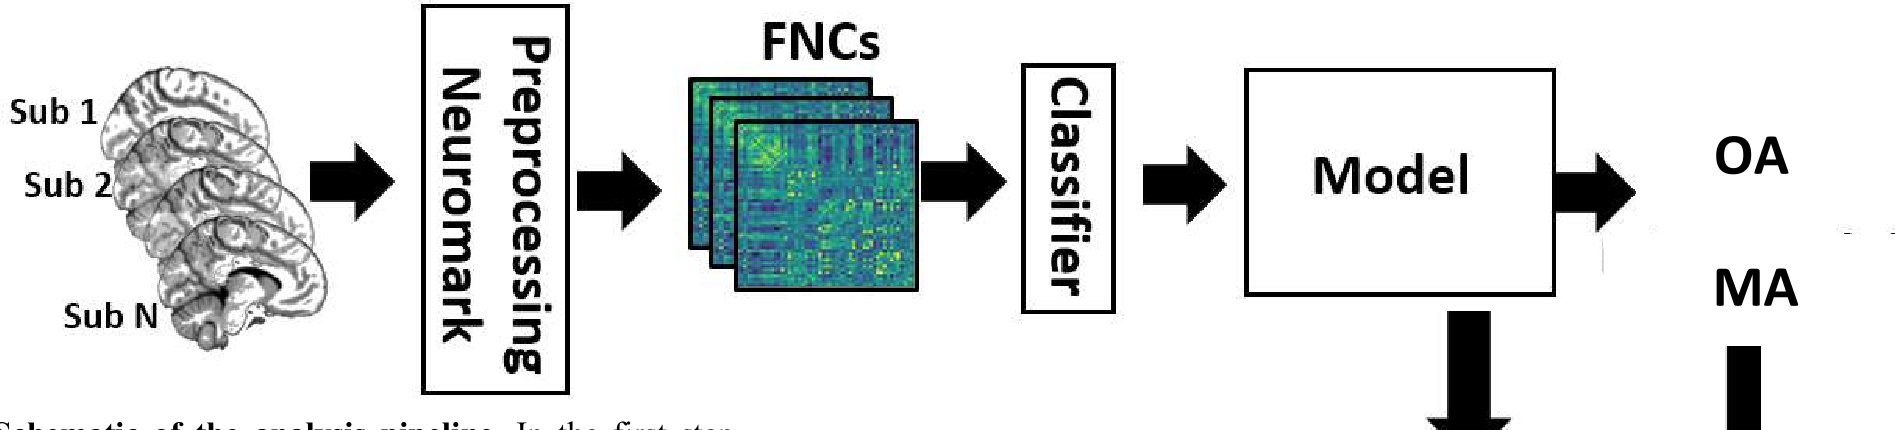 The Figure above illustrates the pipeline from fMRI preprocessing to SHAP feature explanation.
Experiments & Results: Identifying Aging "Hotspots"
The models performed reliably, with XGBoost and CATBoost leading the way (AUC ~0.75). However, the real value lies in the feature importance visualization.
Key Findings:
- The Disruptive Pattern: Aging doesn't just mean "less connectivity." The SHAP analysis revealed a "disrupted pattern"—some connections increased while others decreased.
- Dominant Networks: The Cognitive Control Network (CCN) and Subcortical Network (SCN) were overrepresented in the top-performing features. For instance, in the Random Forest model, 13 of the top 20 features involved the CCN.
- Model Consensus: 25% of the top 20 features were identical across all three distinct models, suggesting a robust biological signal rather than an algorithmic artifact.
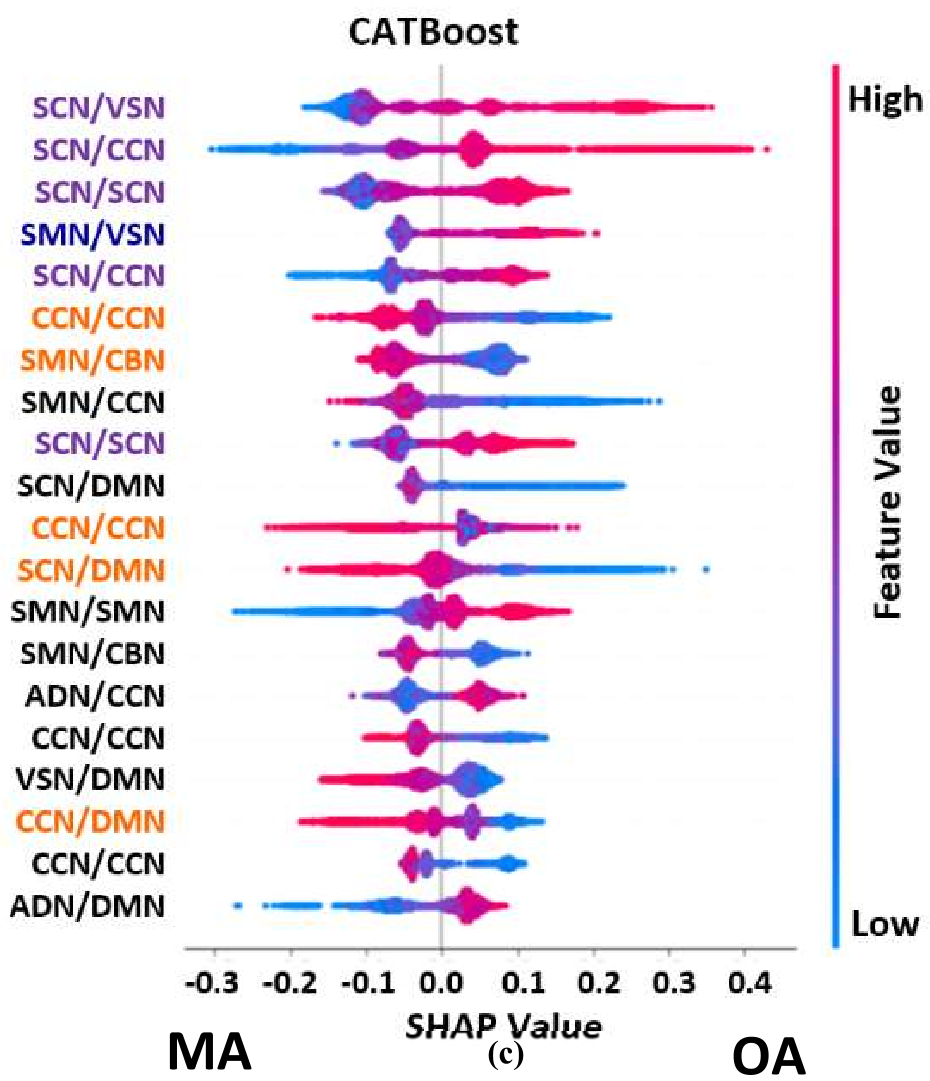 SHAP summary plots show how specific network interactions (like SCN-VSN) push the model's prediction toward the 'Older Adult' category.
Critical Analysis & Conclusion
This study proves that XAI is a powerful tool for neuroscientists. Instead of just saying a model is "69% accurate," we can now see exactly which brain circuits are failing or adapting.
Takeaway: The heavy involvement of the CCN and SCN suggests that the brain's executive management and internal relay systems are the primary frontiers of middle-to-old age transition.
Limitations: While the dataset is large, it is restricted to European ancestry. Future work should validate these markers across diverse populations and explore whether these FNC "disruptions" accurately predict clinical cognitive decline before symptoms appear.
Future Outlook: Integrating SHAP with deep learning models (like Graph Neural Networks) could further refine our understanding of the brain's "connectome" and lead to early-warning systems for age-related disorders.