
3DLAV: Transforming Social Learning through 3D Visualization
Visualizing Learning Activities in Social Network
The paper introduces 3DLAV (3D Learning Activities Visualization), a web-based 3D visualization model designed to map social learning activities within educational networks. Developed using HTML5 and Three.js, it translates complex student interactions—such as course participation and collaborative study—into an interactive 3D "learning space" to enhance student engagement.
TL;DR
Researchers have developed 3DLAV, a 3D visualization tool that turns dry social network data into an interactive virtual space. By mapping students and their subjects as interconnected nodes in a 3D environment, the system makes remote learning more "fun," helps students find study partners, and significantly boosts academic motivation.
Motivation: The Social Network Noise
In the era of "Massification of Education," students are increasingly using social networks for study. However, these platforms often suffer from the "Paradox of Choice" and information overload. Students want to know: What are my peers studying? Who is struggling with the same subject? Where is the activity happening?
Traditional LMS logs and 2D social graphs are often too cluttered to be useful. The authors identified a clear gap: we have the data, but we lack an intuitive way to see the community.
Methodology: Mapping the Learning Space
The authors propose a system called 3DLAV (3D Learning Activities Visualization). Built on a modern web stack (HTML5, CSS3, and JavaScript), it leverages the Three.js engine to create a high-performance 3D interface accessible from any mobile device.
The Architecture
The system follows a clean MVC (Model-View-Controller) pattern:
- Model: A database that pulls real-time learning activity from servers (like KOPO MES).
- View: The 3D Engine that renders students as spheres and connects them via activity-based "edges."
- Control: A 3D Navigation Interaction Driver that allows users to zoom, rotate, and traverse the social network.
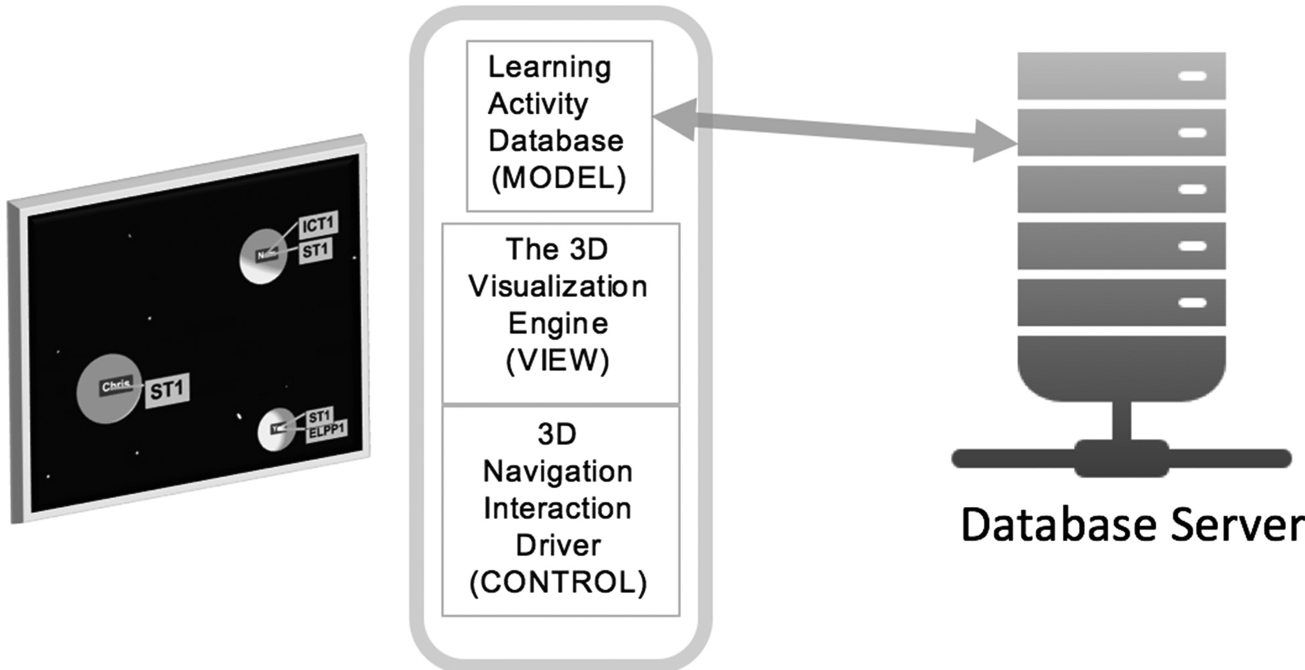 Figure 1: The proposed system architecture showing the interaction between the 3D engine and the learning database.
The Interaction Logic
By representing each user as a sphere, the system creates a "galaxy" of learning. Spheres with shared activities are clustered and connected, allowing a student to immediately identify "hubs" of knowledge or peer groups they can join.
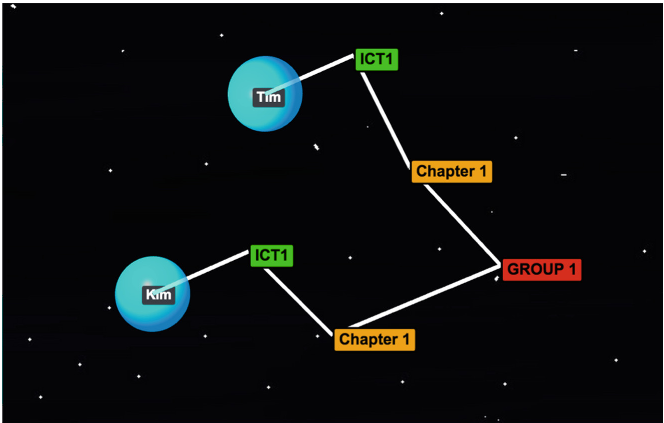 Figure 2: Visual representation of social relations where users (spheres) are connected through shared learning activities.
Experiments & Results: Does It Actually Help?
To test the effectiveness of 3DLAV, the researchers conducted an experiment with students from James Cook University (JCU). They used the USE Questionnaire (Usefulness, Satisfaction, and Ease of Use) with a 5-point Likert Scale (1 = Strongly Agree).
Key Findings:
- Clarity and Overview: The system scored an impressive 1.27 on providing a good overview of courses, suggesting that 3D is superior to lists or 2D charts for high-level data.
- Motivation: Students reported that seeing others' activities motivated them (score 1.50), reducing the feeling of isolation common in m-learning.
- Ease of Use: With a score of 1.41 for simplicity, the system proved that 3D environments don't necessarily have to be complex or require steep learning curves.
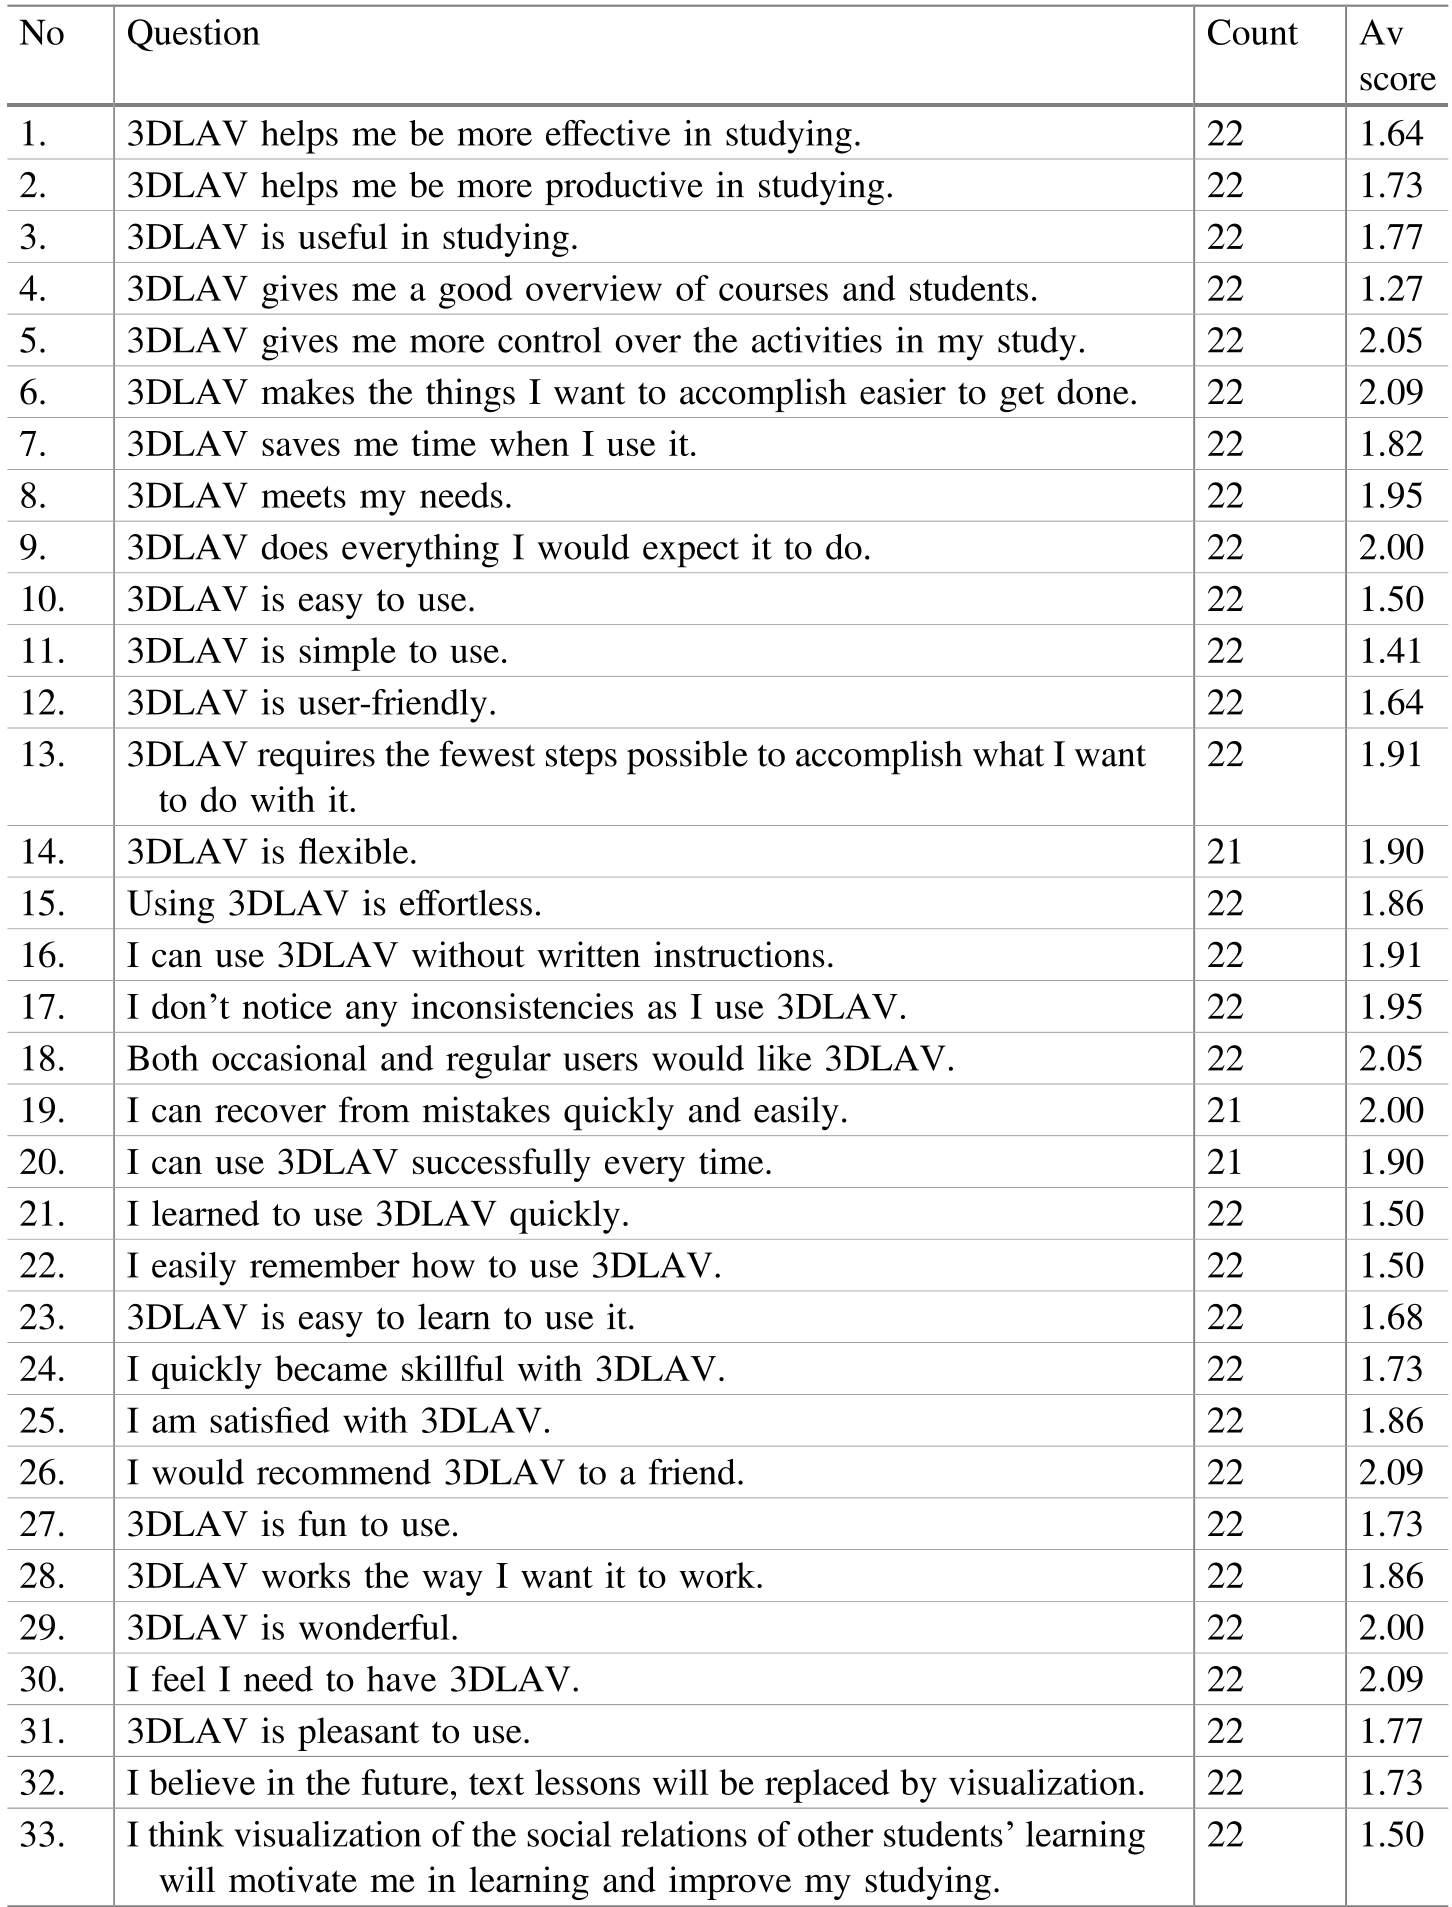 Table 1: Quantitative results from the student survey highlighting high scores in effectiveness and ease of use.
Critical Analysis & Conclusion
Takeaway
The core achievement of 3DLAV is its ability to turn abstract data into social presence. By visualizing "learning activities," it transforms a lonely digital experience into a collaborative one. It helps students avoid common mistakes by observing the "pathways" of others and highlights focus areas that might otherwise be missed.
Limitations & Future Work
While the results are promising, the study used a relatively small sample size (n=23) and synthetic data for parts of the setup. Future research should look into:
- Scalability: How does the 3D visualization handle thousands of students simultaneously?
- Privacy: Balancing the visibility of learning activities with student data privacy.
- Real-time Integration: Moving beyond periodic data retrieval to a truly live "learning pulse" of the university.
In conclusion, 3DLAV proves that the future of education isn't just about delivering content—it's about visualizing the community that learns together.