
VSI-EWMA: Enhancing Social Network Monitoring through Adaptive Statistical Design
Statistical design of a VSI-EWMA control chart for monitoring the communications among individuals in a weighted social network
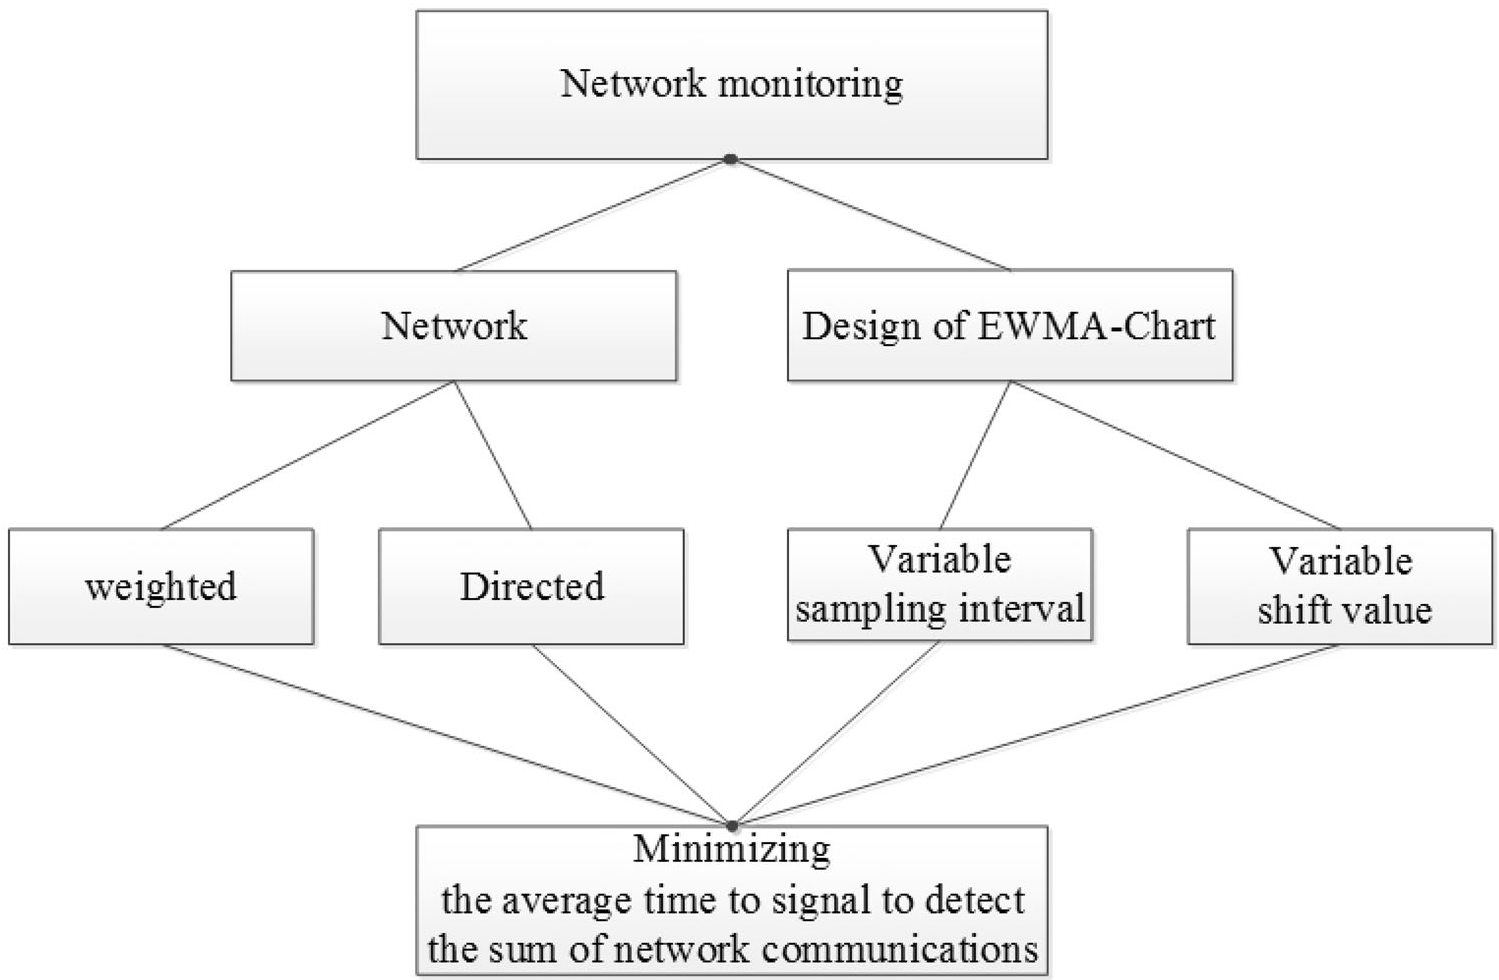
This paper presents a statistical design for a Variable Sampling Interval Exponentially Weighted Moving Average (VSI-EWMA) control chart specifically for monitoring communications in weighted and directed social networks. It utilizes a Particle Swarm Optimization (PSO) algorithm to minimize the Average Time to Signal (ATS) under stochastic shift conditions.
Executive Summary
TL;DR: This research introduces an optimized VSI-EWMA (Variable Sampling Interval Exponentially Weighted Moving Average) control chart designed to monitorweighted, directed social networks. By allowing the sampling frequency to adapt to the current state of network activity and treating potential shifts as random variables (Rayleigh distributed), the method detects anomalous communication patterns significantly faster than traditional static charts.
Background: Within the landscape of Social Network Monitoring (SNM), this work moves beyond simple binary connections to analyze "weighted" ties (e.g., frequency of emails/calls). It transitions from basic SOTA刷榜 (SOTA leaderboard chasing) to a rigorous Economic-Statistical Design framework, focusing on the real-world problem of stochastic changes.
Problem & Motivation: The Limits of Static Monitoring
Traditional control charts in social network analysis primarily suffer from three "blind spots":
- Fixed Parameters: Using pre-set limits rather than optimized ones reduces the power to detect subtle changes.
- Fixed Sampling Intervals: Monitoring a network every hour regardless of suspicion is inefficient. If a network starts acting "suspiciously," we should monitor it more frequently.
- Deterministic Shift Assumptions: Most models assume an "assignable cause" results in a fixed, known change in communication volume, whereas real-world threats (like disease spread or criminal planning) evolve stochastically.
Methodology: Adaptive Precision
The core innovation lies in the VSI (Variable Sampling Interval) mechanism. The monitor divides the network state into three zones:
- Safe Zone: Use a long interval () to save resources.
- Warning Zone: Use a short interval () to increase vigilance.
- Out-of-Control Zone: Trigger an immediate alarm.
The model tracks the total number of communications (), which is approximated by a Normal distribution (derived from Poisson parameters). The EWMA statistic () incorporates past information to maintain "memory," making it highly sensitive to small shifts.
Optimization via Particle Swarm Optimization (PSO)
Because the mathematical model is non-convex and involves complex Cumulative Distribution Functions (CDF), the authors use PSO to find the optimal balance between (smoothness), and (limit coefficients).
Experiments & Results: Faster Detection Saves Time
The authors validated their model using a dataset of a criminal suspect network (20 nodes). They measured the Average Time to Signal (ATS)—the lower the ATS, the faster a threat is detected.
Key Comparison: VSI vs. Fixed EWMA
The results confirm that the VSI-EWMA is superior across all shift magnitudes ():
- Small Shifts: Improved detection speed by 22.44%.
- Large Shifts: Improved detection speed by 11.54%.
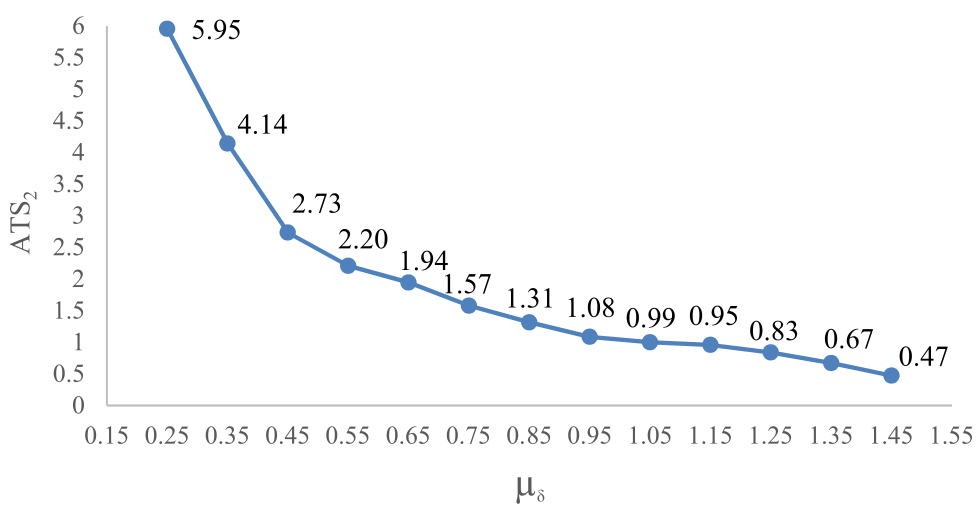
The logic is intuitive: when the system detects a point in the warning zone, the VSI chart immediately "tightens" the sampling interval, catching the next out-of-control point much sooner than a chart that waits for the next fixed-time check.
Critical Insight & Conclusion
Takeaway
This paper serves as a bridge between Statistical Quality Control and Social Network Science. It demonstrates that "how often you look" is just as important as "what you look at." For security agencies, this means higher detection rates for organized threats with fewer wasted resources during periods of normalcy.
Limitations & Future Work
The current model assumes a static network (constant number of nodes). In real-world social media or epidemiology, nodes (users/infected individuals) fluctuate. Future research should integrate Dynamic Network Measures and deep learning-based embeddings to handle the high dimensionality of modern social data while maintaining the statistical rigor of VSI charts.