
Decoding the Pulse of Social Networks: A Wavelet-Based Approach to User Clustering
Wavelet-Based Clustering of Social-Network Users Using Temporal and Activity Profiles
This paper introduces a wavelet-based hierarchical clustering framework to categorize social network users based on their temporal activity profiles. By applying Daubechies wavelet transforms and multi-level K-means clustering, the authors identify distinct user groups across Twitter and intra-enterprise social platforms.
TL;DR
Why do some social networks thrive while others become ghost towns? This research moves beyond "who is friends with whom" to analyze the temporal rhythm of user activity. By using Wavelet Transforms, the authors decompose complex user activity logs into multi-scale patterns, revealing that the vast majority of users are irregular "lurkers," while the most "active" accounts are often just automated bots or news feeds.
The Temporal Blind Spot in Social Analytics
Most Social Network Analysis (SNA) treats users as static nodes in a graph. However, the utility of a network—especially an enterprise knowledge platform—depends on consistency. Existing methods struggle to cluster users based on time-series data because:
- Scale Invariance: A user might be active daily or monthly; standard Euclidean distance often fails to see the structural similarity between these patterns.
- Noise: High-frequency spikes in activity can mask underlying long-term trends.
The authors argue that we need a way to look at data at different "resolutions"—much like a microscope—to distinguish between a one-time viral poster and a dedicated expert contributor.
Methodology: The Power of the Wavelet
The core innovation lies in the Discrete Wavelet Transform (DWT). Unlike Fourier transforms which only capture frequency, Wavelets are "spatial-temporal," meaning they tell us what happened and when.
1. Multi-Resolution Decomposition
The team used the Daubechies2 wavelet to break down a user's activity (e.g., number of tweets per day) into:
- Approximation Coefficients: The "big picture" or average activity level.
- Detail Coefficients: The "rhythm" or specific bursts of activity.
2. Hierarchical K-Means
Instead of clustering all data at once, the algorithm works top-down:
- Level 1: Group users by their coarsest behavior (High vs. Low activity).
- Level 2+: Within those groups, refine the clusters using detail coefficients to separate "regular contributors" from "sporadic spikers."
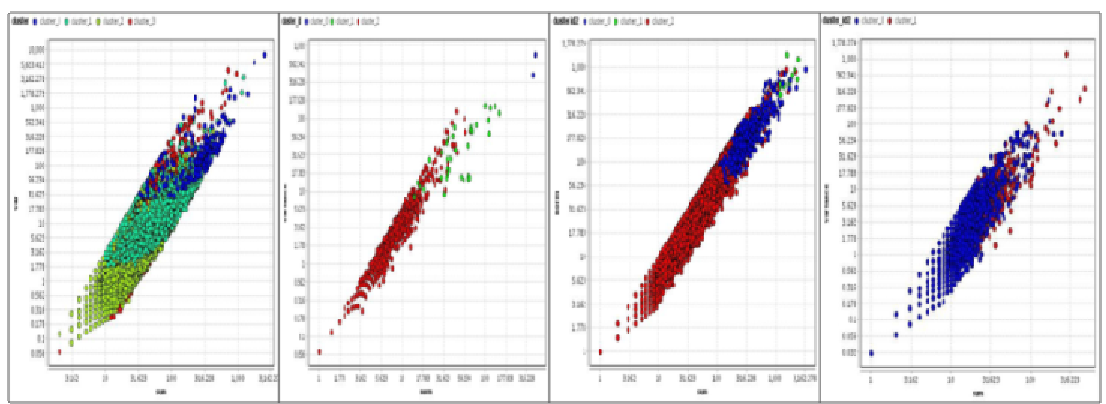 Fig 1: Initial coarsest-level clusters across different datasets, showing the massive skew toward low-activity users.
Experimental Insights: The "Lurker" Reality
The researchers tested their method on two Twitter datasets and two Enterprise Social Network Portal (ESNP) datasets. The results were sobering for community managers:
- The 90-9-1 Rule Validated: In ESNP, up to 93% of users fell into the "inactive/infrequent" cluster.
- The "News Bot" Dominance: On Twitter, the most active "users" were not humans but news agencies (e.g., BreakingNews).
- The Engagement Gap: In the enterprise setting, 57% of users who logged in one month failed to return the next.
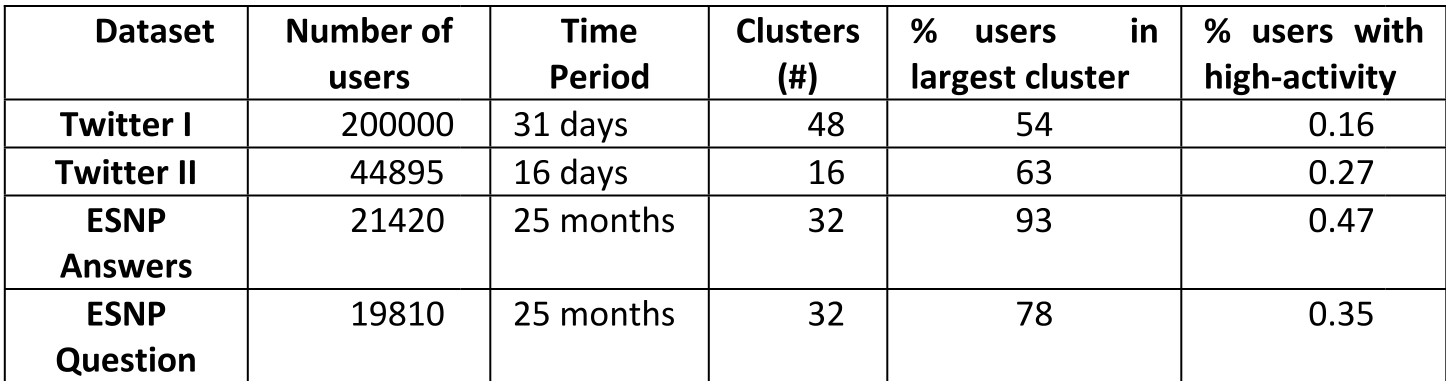 Table 1: Dataset statistics and clustering results. Note the tiny percentage of high-activity users.
Furthermore, when analyzing content, the "high-activity" group in the enterprise was mostly discussing "Fun and Entertainment" rather than technical knowledge. This suggests that while the platform builds "social capital" and bonding, it struggles to fulfill its mission as a professional knowledge repository.
Deep Insight & Future Outlook
The brilliance of this paper is the application of signal processing (Wavelets) to social science. It proves that temporal behavior is a fingerprint.
Key Takeaways:
- For Data Scientists: Wavelet coefficients provide a superior, compressed feature set for time-series clustering compared to raw activity logs.
- For Product Managers: The high attrition rate in enterprise networks suggests that "gamification" or "incentive schemes" are not optional—they are necessary to keep the "Detail Coefficients" (the rhythm of activity) from flatlining.
Limitations: The study was conducted on datasets from 2008-2010. Modern social networks, driven by algorithmic feeds, may exhibit different temporal signatures that require even more complex wavelet bases to decode.
Conclusion
By treating user activity as a signal to be decomposed rather than just a number to be summed, this work provides a robust framework for identifying who is actually "alive" in a social network. Whether you are hunting for influencers or trying to revive a dying internal forum, the math of wavelets offers a clearer view through the noise.