
Pioneering Whole-Heart ECV Estimation: A New Standard for Cardiac CT
A Framework of Whole Heart Extracellular Volume Fraction Estimation for Low-Dose Cardiac CT Images
This paper introduces a novel image processing framework for estimating 3-D whole heart Extracellular Volume (ECV) fraction using low-dose Cardiac CT (CCT). The method combines shape-constrained Graph Cuts (GC) for segmentation and symmetric demons for deformable registration, achieving a highly reproducible alternative to traditional 2-D ROI-based manual measurements.
TL;DR
Quantifying diffuse myocardial fibrosis—a key indicator of heart failure—no longer requires expensive MRI or tedious manual 2-D measurements. This paper presents a semiautomated 3-D framework that leverages low-dose Cardiac CT (CCT) to generate voxel-wise Extracellular Volume (ECV) maps, achieving higher reproducibility and global coverage than previous manual methods.
Problem & Motivation: The 2-D Limitation
Diffuse pathologic fibrosis is a hallmark of cardiac remodeling, yet quantifying it non-invasively remains challenging. While Cardiac MRI (CMRI) is the current gold standard for ECV estimation, it faces hurdles:
- High Cost & Accessibility: CMRI is expensive and time-consuming.
- Patient Exclusions: Claustrophobia and metallic implants (pacemakers) often preclude MRI.
- The 2-D Trap: Most current ECV measurements use 2-D "Regions of Interest" (ROIs). Since fibrosis is a global, diffuse process, 2-D slices may fail to represent the "whole heart" health.
The authors recognized that CCT, while ubiquitous, suffered from poor contrast in pre-contrast images. Their goal: create a robust registration and segmentation pipeline to make 3-D Whole-Heart CCT ECV a reality.
Methodology: The Core Framework
The framework addresses the challenge of matching voxels between two distinct scans (pre-contrast and post-contrast) to measure iodine uptake accurately.
1. Shape-Constrained Graph Cut Segmentation
Segmentation of the myocardium is difficult because the blood pool and heart muscle share similar intensities. The authors employ a hybrid approach:
- Initialization: User-steered Live Wire (LW) defines contours on a few slices.
- Geometric Priors: These contours are interpolated to create a 3-D shape constraint.
- Optimization: This shape prior is integrated into a Graph Cut (GC) energy function, ensuring the final segmentation respects both image gradients and physiological shapes.
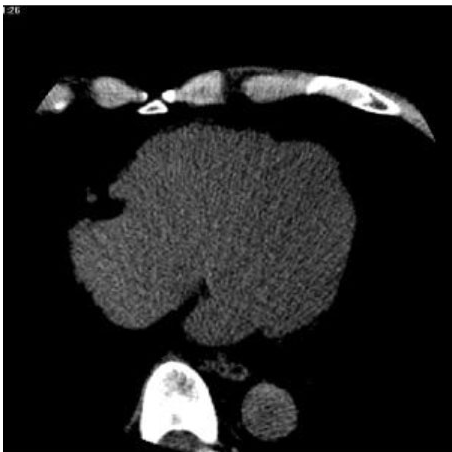 Figure 1: Comparison of pre-contrast and post-contrast CCT images showing the difficulty in myocardium differentiation.
2. Symmetric Demons Registration
To calculate ECV, one must subtract the pre-contrast HU from the post-contrast HU at the exact same anatomical location. Because the heart moves and deforms between scans, linear registration isn't enough. The authors use the Symmetric Demons algorithm, which treats image matching as a diffusion process, ensuring smooth and physically plausible deformations.
Experiments & Results: Precision Meets Speed
The method was validated against expert manual segmentations and 20 clinical datasets (including heart failure subjects).
- Performance: The segmentation achieved a True Positive Volume Fraction (TPVF) of 92.2% for the myocardium.
- Reproducibility: This is where the framework shines. The automated method reached an Inter-user R² of 0.961, significantly outperforming the manual method’s 0.900.
- Clinical Differentiation: The framework successfully identified a higher ECV in heart failure patients compared to normal subjects, as visualized in 3-D heatmaps.
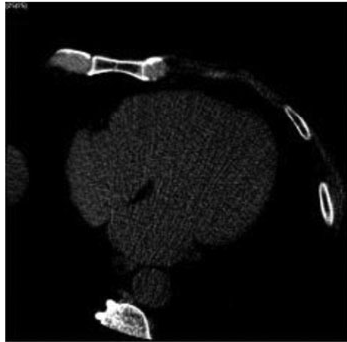 Figure 2: 3-D CCT ECV map visualization. Left: Normal subject; Right: Heart failure subject showing significantly higher ECV values.
Critical Analysis & Conclusion
Takeaway
By moving from 2-D slices to a 3-D voxel-wise framework, this research provides a more holistic view of cardiac health. The use of low-dose protocols also ensures that the radiation burden remains within clinical safety limits.
Limitations & Future Work
The current framework is semiautomatic, requiring initial user input via the Live Wire method (approx. 10 landmarks per slice). While this is much faster than manual ROI drawing, the authors note that shifting toward a fully automatic system—perhaps by utilizing CT Angiography (CTA) images as a reference for blood pool segmentation—is the logical next step.
In conclusion, this study bridges the gap between the high-availability of CT and the high-diagnostic value of ECV mapping, offering a robust tool for the future of cardiovascular diagnostics.