
Decoding Urban Dynamics: Why Social Media Mining is the Key to Smart City Logic
Why are these people there? An analysis based on Twitter
The paper presents a spatio-temporal social mining methodology to identify the underlying reasons for unexpected urban crowds using Twitter data. By combining DBSCAN for geo-cluster detection with k-means and hierarchical clustering for text analysis, the authors successfully identified "International Workers' Day" (May Day) protests in Madrid as the semantic driver of a detected crowd.
TL;DR
Researchers have developed a methodology to not only detect where crowds form in a city but to explain why they are there. By analyzing 21,116 geo-tagged tweets during Madrid's May Day, the study demonstrates that combining density-based spatial clustering (DBSCAN) with localized text mining reveals the hidden motivations of a crowd—transforming raw GPS data into actionable urban intelligence.
Motivation: Moving Beyond "Where" to "Why"
In the context of Smart Cities, detecting a crowd is a solved problem. We use GPS, Wi-Fi pings, and cellular handovers to identify "outliers"—places where more people are gathered than usual. However, a crowd at a stadium is different from a crowd at a political protest or a sudden emergency.
The challenge is that Twitter data—the best source for "public sentiment"—is notoriously messy. Messages are short, full of slang, and context-dependent. This paper addresses the gap by asking: Can we refine high-level noise into specific, localized "event reasons"?
Methodology: The Two-Tiered Semantic Lens
The authors don't just look at what all of Madrid is saying. They use a hierarchical approach:
- Global Detection: Using DBSCAN, they identify geo-clusters that deviate from a "normal day" baseline.
- Macro-Analysis: They apply K-means and Ward’s Hierarchical Clustering to the entire day's text. They use the "Elbow Method" to determine the optimal number of topics (k=6).
- Micro-Analysis (Spatio-Temporal): This is the core innovation. They slice the data into 30-minute windows and focus only on the geo-outlier coordinates (e.g., Puerta del Sol).
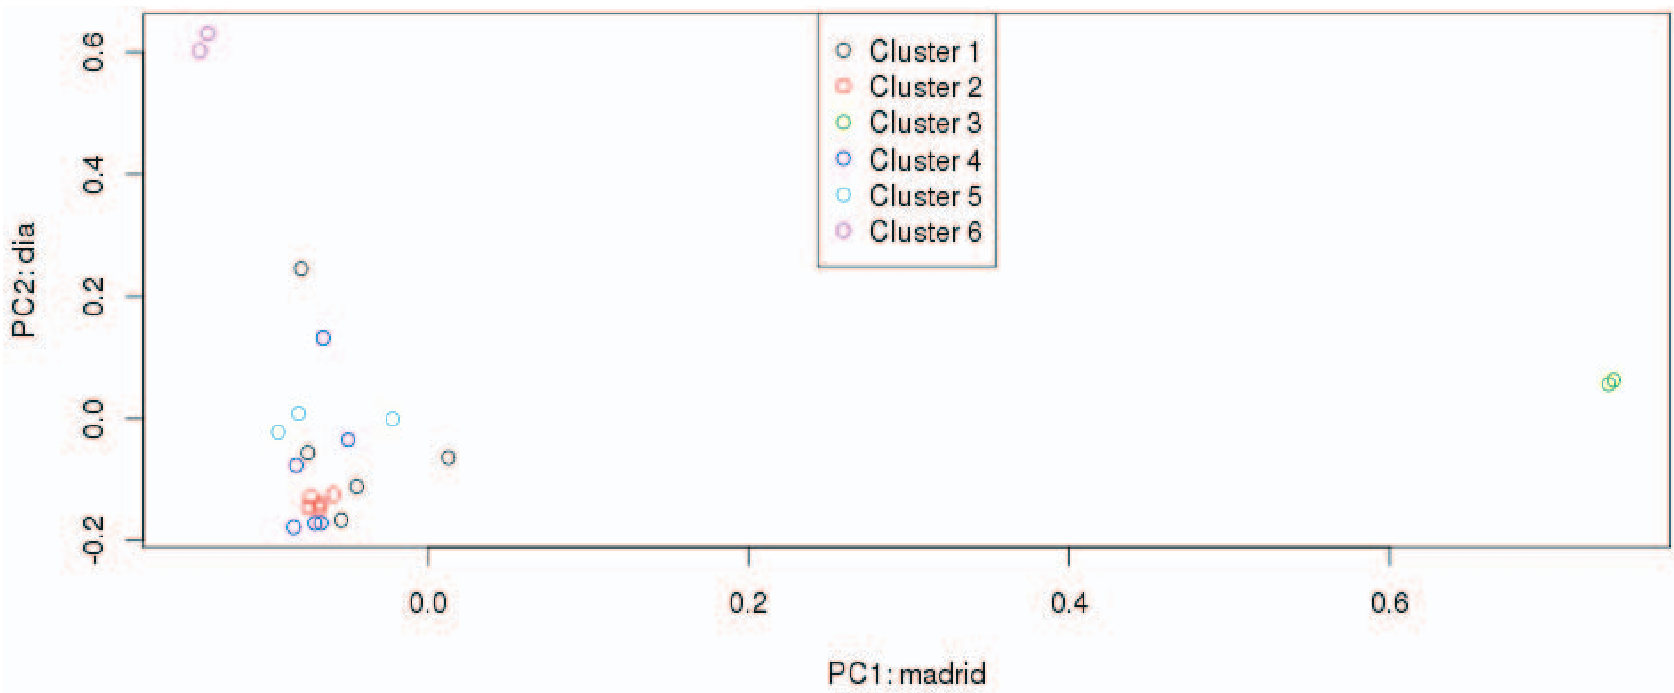 Figure 1: High-level visualization of term correlations using k-means.
The Case Study: May Day in Madrid
The experiment analyzed the International Workers' Day (May Day).
- The Baseline: Five "normal" days were used to establish what regular Twitter activity in Madrid looks like.
- The Findings: While a general daily analysis showed common words like "Madrid" or "Day," the 30-minute localized analysis at the city center (Puerta del Sol) suddenly surfaced highly specific terms: trabajadores (workers), protestas (protests), and #felizdíadelparado (happy day for the unemployed).
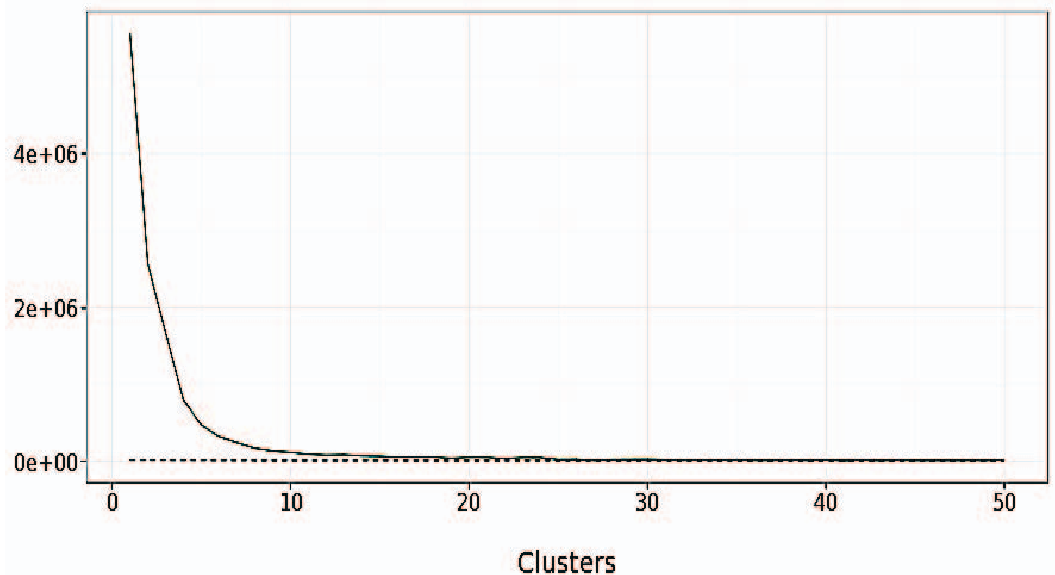 Figure 2: Ward's Method Dendrogram showing the semantic relationship between "May," "Morning," and "Day" keywords.
Critical Results: The Power of Context
The study proved that as you move closer to the "epicenter" of a crowd, the Tag Clouds become more descriptive.
- 12:00 PM - 1:00 PM: This window was identified as the "critical time."
- Spatial Dependency: Groups within 5km of the city center shared a high frequency of "protest" keywords, whereas tweets outside this radius remained focused on general social chatter.
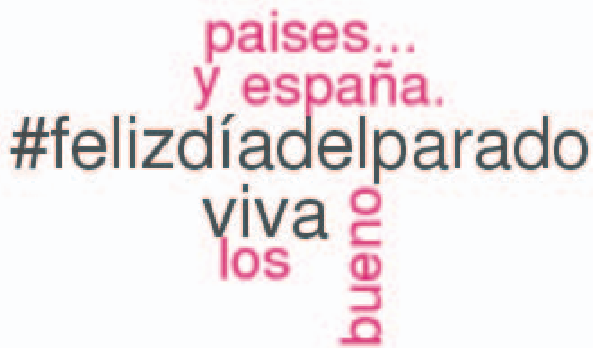 Figure 3: Localized Tag Cloud showing high-intensity keywords at the protest peak.
Deep Insight & Conclusion
This research moves the needle in Smart City management by providing a framework for unpredictable crowd analysis. While May Day was a "predictable" event used for validation, the same methodology could be deployed for spontaneous riots, accidents, or flash mobs.
Limitations: The reliance on GPS-tagged tweets is a bottleneck, as only a small fraction of users enable location services. Future Work: The authors suggest integrating Foursquare and other location-based social networks (LBSNs) to create a multi-source "Urban Pulse." By moving toward automated, real-time semantic labeling, city planners can finally understand the "vibe" and "intent" of the city at a granular level.